
Adventure Seeking on Hiking Tracks in the Central European zone: A Geospatial Analysis and Recommendation System
This geospatial project investigates the adventure-seeking behavior of hikers on trails in the Central European zone. The main goal is to understand the factors that influence the choice of a particular track and to develop a recommendation system for hikers based on their preferences and needs. To achieve this objective, I used a combination of spatial analysis techniques, field data collection, and machine learning algorithms. The study analyzed a wide range of variables such as track difficulty, distance and elevation gain, as well as the demographic characteristics and habits of hikers. The results provide valuable insights for the management and promotion of hiking trails in the Central European zone and can help improve the outdoor recreation experiences of hikers by suggesting suitable tracks based on their individual preferences and goals.
Research questions and objectives:
- Where and when people go hiking in the Central European zone?
- Can these data be used to extract useful information about the hiking tracks in the Central European zone? Like see if the positions of the tracks are related to the presence of intresting points, like lakes, waterfalls, huts, etc.
- Can machine learning algorithms be used to develop a recommendation system for hikers based on their preferences and goals?
Project structure
The study was divided into two main areas: data collection and spatial analysis. In the data collection phase, I gathered a wide range of tracks coming from the website hikr.org through the License: CC0, after I cleaned and processed the data to ensure its quality and consistency. In the spatial analysis phase, I used a variety of tools and techniques in order to examine the characteristics and features of hiking tracks in the Central European zone.
Analysis workflow
The analysis workflow is divided into three main files: analysis_1/2/3.py.
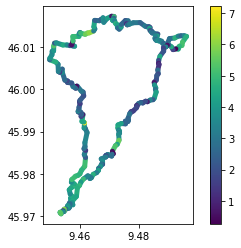
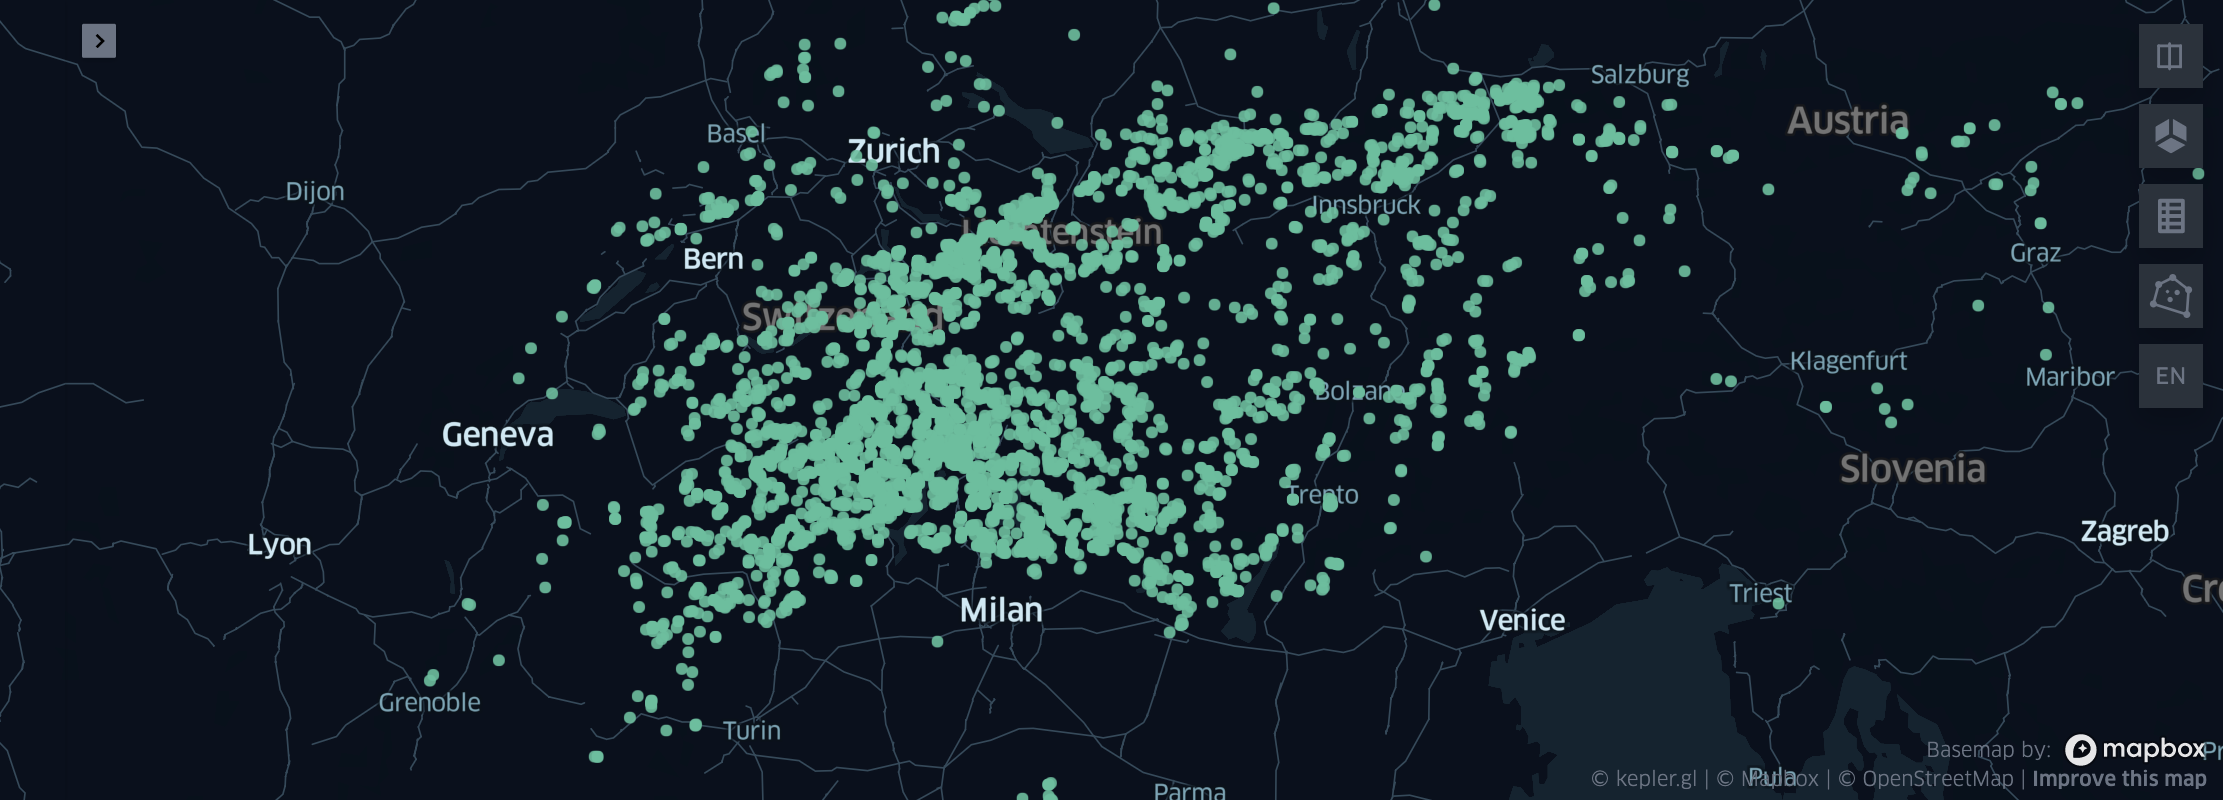
- analysis_1.py: In this file, I used the geopandas library to perform spatial analysis on the hiking tracks. The analysis included the calculation of new columns useful to study the data, such as the season of the year or the number of tracks per user, after one example of track is shown in order to have a better understanding of the data. This will answer the first research question: “Where and when people go hiking in the Central European zone?” Now we can see that the most popular tracks are in the summer and that the most popular tracks are in the Alps.
- analysis_2.py: Here deeper analysis have been performed. In order to cover the larger part of the topics studied during the course I: found the circle tracks, by extracting the starting and finishing points and comparing them by distance, performed map matching, by searching for intersactions between the tracks and the reference map of GraphHopper, and finally I calculated the so called “intresting points” so the points in the same tracks where a significant number of people have stopped for a while (this can suggest us that there is a natural attraction, lakes or waterfalls, a hut or a refreshment area). This will answer the second research question: “Can these data be used to extract useful information about the hiking tracks in the Central European zone? Like see if the positions of the tracks are related to the presence of intresting points, like lakes, waterfalls, huts, etc.” Thanks to the stop points analysis we can see that the largest parts of the tracks are near the intresting points, like lakes, so we can say that the tracks are related to the presence of intresting points.
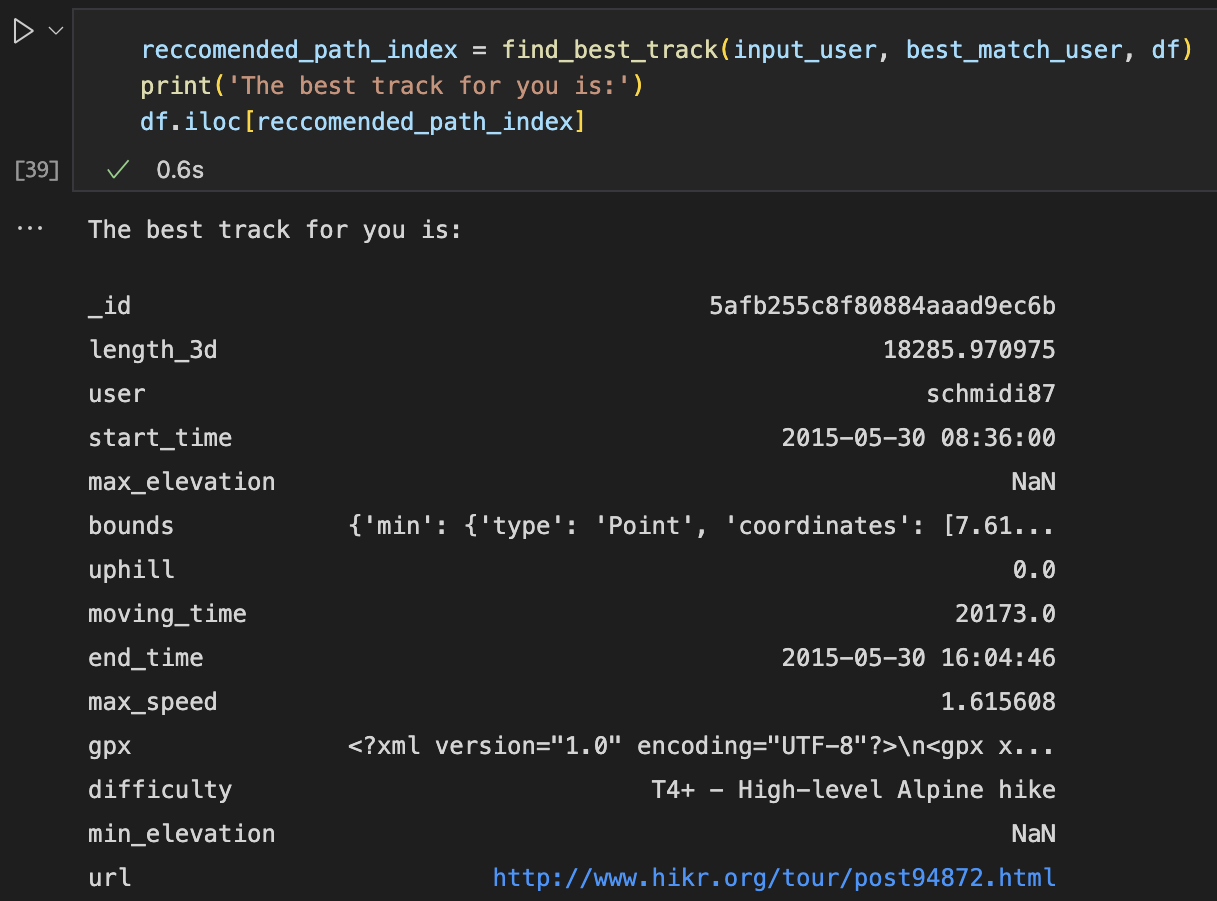
- analysis_3.py: In this file I used the scikit-learn library to perform machine learning algorithms. The analysis included the calculation of the most important features for the prediction of the track difficulty. After a reccomendation system has been developed, which is based on the user’s preferences and goals. Running the code the name of a existing user will be asked and the system will suggest the best tracks for him/her. In the code you can see how a brief example has been setted up, in order to show how the system works. The user (someone already registered in the system) has to insert his/her name (“siso” is the default example) and the system will suggest first the user that best match with him/her characteristics (“schmidi87” for the default case) and the best tracks from the currespondent user. This will answer the third research question: “Can machine learning algorithms be used to develop a recommendation system for hikers based on their preferences and goals?”. Albeit the system is very simple, it can be used to suggest tracks to the user based on his/her preferences and goals. So the answer is yes. A lot of work can be done to improve the system, for example by adding more features to the dataset, or by using more complex algorithms.
Final results
The results of the analysis show that the most popular tracks are in the summer and that the most popular tracks are in the Alps. The analysis also shows that the largest parts of the tracks are near the intresting points, like lakes, so we can say that the tracks are related to the presence of intresting points. Finally, the results of the machine learning algorithms show that the most important features for the prediction of the track difficulty are the distance, the elevation gain and the number of tracks per user. The recommendation system is able to suggest tracks to the user based on his/her preferences and goals.
Future work
The results of this study provide valuable insights for the management and promotion of hiking trails in the Central European zone. The results can also help improve the outdoor recreation experiences of hikers by suggesting suitable tracks based on their individual preferences and goals. Future work can be done to improve the recommendation system by adding more features to the dataset, or by using more complex algorithms. Some additional features example are:
- The mean speed of the track
- The number of intresting points in the track
- The distance between the input user residence and the tracks
- The number of tracks per user in the same area
- The number of tracks per user in the same season
- The age and the experience of the user
Other analysis can be done, for example by using the data of the intresting points to see if there is a correlation between the number of people that stop in a certain point and the number of people that go to that point. This can be done by using the stop points analysis and the intresting points analysis. We can see if the tracks are intersecting each other or based on the datatime of the gpx points, see if two persons have been in the same point at the same time.